

ESC or click to close
|
Press releases and reports
Self-assessment of the health`s state by the population of Ukraine
Press release by Oleksii Lyshtva On May 18-30, 2018, Kyiv International Institute of Sociology (KIIS) conducted an all-Ukrainian public opinion poll. Data were collected from 2025 respondents living in 108 settlements in all oblasts of Ukraine (except for the AR of Crimea) with the method of personal interviewing. The sample was stochastic, and it is representative of the population of Ukraine aged 18 and above. In Luhansk and Donetsk oblasts survey was conducted only in the territories that are controlled by the Ukrainian government. The statistical sampling error (with a probability of 0.95 and for a design effect of 1.5) does not exceed: 3.3% — for indexes close to 50%, 2.8% — for indexes close to 25%, 2.0% — for indexes close to 10%, 1.4% — for indexes close to 5%.
Kyiv International Institute of Sociology monitors the dynamics of self-assessment of the state of health among the Ukrainians since 1995. Survey data show that over the past five years, the state of health of Ukrainian residents remains virtually unchanged: in comparison with 2013, research does not record either improvement or a statistically significant deterioration in how Ukrainian residents assess their own health status. However, if compared with 1995, it is noticeable that the level of the health self-esteem has increased.
 In general, as of May 2018, 37% of adult respondents in Ukraine assessed their health as good or very good, 42% - as mediocre (neither good nor bad), 19% - as bad or very bad.   Various factors influence the health status, including age, gender, level of financial well-being, place of residence, other factors. First of all, the state of health is closely related to the age: the older is the person, the greater is the likelihood that he/she will have some kind of a health problem. According to the combined data from studies conducted during two years (May 2015 - May 2017), among young people aged 18 to 29 years, 69% feel healthy, from age 30 to 39 - 55%, 40-49 years old – 40%, from 50 to 59 years – 26%, 60 to 69 years - 13%, and among the older 70 - only 8%. Gender also affects the self-esteem of health: in all age groups, men evaluate their health a little better than women. In general, 45% of all men over the age of 18 and older are healthy, among women - 33%.
 As before, there is a strong link between the health and the well-being: the better is the financial standard of living, the greater is the number of those who have good health. According to the polls of 2015-2018, among the least affluent (those who lack even money for food), only 22% called themselves healthy people, 70% - among people with a relatively high level of material welfare (can afford to buy expensive things). That is, a higher level of well-being provides better opportunities for caring for your own health, both for disease prevention and for treatment.
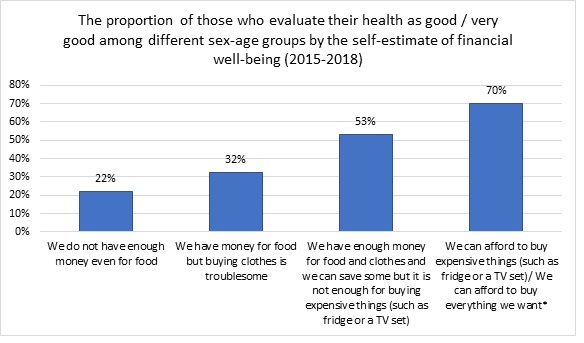 * Note: the category "We can afford to buy everything we want" during the analysis was united with the category «We can afford to buy some expensive things” due to an insufficient filling of the former. The percentage of those who feel healthy is slightly higher in urban areas (40%) than in rural areas (34%). This may be due both to work conditions and level of material well-being (which is better in cities than rural areas) and to the availability of health services (a more developed network of medical institutions in cities).  The state of health is an essential condition for happiness: among those who have very good health, 87% feel happy, and only 19% are happy among those who have very poor health.  ADDITION Table 1.Distribution of answers to the question “How would you evaluate the state of your health?" (Ukraine without the temporarily occupied territories, %)
Table 2. Self evaluation of the health status – distribution by age (combined data for 2015-2018, %)
Table 3. Self evaluation of the health status – distribution by sex (combined data for 2015- 2018. %)
Table 4. Self evaluation of the health status – distribution by age and sex (combined data for 2015- 2018. %)
Table 5. Self evaluation of the health status – distribution by the financial well-being (combined data for 2015- 2018. %)
* Note: the category "We can afford to buy everything we want" during the analysis was united with the category «We can afford to buy some expensive things” due to an insufficient filling of the former. Table 6. Self evaluation of the health status – distribution by the type of settlement (combined data for 2015- 2018. %)
Table 7. Feeling of happiness – distribution by state of health (combined data for 2015- 2018. %)
Regarding the commentary contact, please, Oleksii Lyshtva: oleksii.lyshtva@kiis.com.ua
27.6.2018
|
||||||||||||||||||||||||||||||||||||||||||||||||||||||||||||||||||||||||||||||||||||||||||||||||||||||||||||||||||||||||||||||||||||||||||||||||||||||||||||||||||||||||||||||||||||||||||||||||||||||||||||||||||||||||||||||||||||||||||||||||||||||||||||||||||||||||||||||||||||||||||||||||||||||||||||||||||||||||||||||||||||||||||||||||||||||||||||||||||||||||||||||||||||||||||||||||||||||||||||||||||||||||||
Our social media:
 KIIS page
 KIIS channel