

ESC or click to close
|
Press releases and reports
Index of happiness: in the world and in Ukraine
The press release was prepared by KIIS intern Olha Cheryomukhina The research in question has been conducted by the Gallup International Association of Independent Research Agencies since 1947 in 42 countries, including Ukraine for some time. Romir Research Holding is a representative of this association throughout the post-Soviet space, and in Ukraine this year this research was conducted by the Kyiv International Institute of Sociology (KIIS) together with the “Democratic Initiatives” Foundation[1].
Commentof the KIIS Director General V. Paniotto watch on the KIIS YouTube channel [1] The field stage in Ukraine was carried out by KIIS, the survey was conducted in early December 2020 by the CATI method (computer-assisted telephone interviews) based on a random sample of mobile phone numbers. The sample is representative for the adult population (18 years and older) of Ukraine. The sample does not include territories that are temporarily not controlled by the authorities of Ukraine - the Autonomous Republic of Crimea, some districts of Donetsk and Luhansk regions. 1000 interviews were conducted during the survey. Statistical sampling error (with a probability of 0.95 and taking into account the design effect of 1.1) does not exceed 3.5%.
In this research, the index of happiness is calculated as the percentage of those who consider themselves happy, minus the percentage of those who consider themselves unhappy. The survey was conducted in early December 2020 by the method of CATI (computer-assisted telephone interviews) based on a random sample of mobile phone numbers. The sample is representative for the adult population (18 years and older) of Ukraine. The sample does not include territories that are temporarily not controlled by the authorities of Ukraine - the Autonomous Republic of Crimea, some districts of Donetsk and Luhansk regions. 1000 interviews were conducted during the survey. Statistical sampling error (with a probability of 0.95 and taking into account the design effect of 1.1) does not exceed 3.5%.
How happy or unhappy you feel in relation to the events of your personal life? 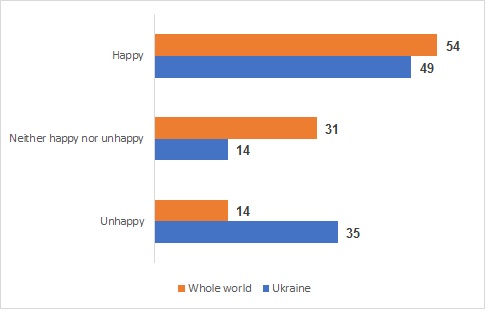 Comparative indicators of the index of happiness in Ukraine in 2019 and 2020 (the index can vary from +100 when everyone is happy, to -100 when everyone is unhappy)
 As Ukraine found itself in a dozen countries whose residents tend to weigh their personal lives unhappy, we provide data on the most "happy" and "unhappy" countries in the world.
Index of happiness by countries. TOP of the most "happy" and "unhappy" countries  eng.jpg) eng.jpg) As you can see, the indicator of happiness depends primarily on the internal local feeling of happiness, and the economic situation of the respondents is also a weighty factor. An interesting aspect is the feeling of happiness of Ukrainians, which is almost on a par with Armenia, which in 2020 waged war with Azerbaijan. The distribution of the index of happiness by different regions of the world can be considered informationally interesting. It reiterates that neither the degree of economic development nor the region directly affects the perception of their lives by people happy or unhappy. In this context, the distribution of the index of happiness by regions of the world is quite informative: Judging by the data, it can be argued that neither the financial situation nor the war does not affect the feeling of happiness in a particular region. Although, of course, such influences are present, they often do not become decisive. Still, the feeling of happiness is the inner feeling of each person or the desire to feel happy or not. Survey results for all countries, 2020
Index of happiness as of 2020 
Coverage of regions: ▪ The EU as a whole unites the EU West and the EU East ▪ West of the EU - Austria, Finland, Germany, Italy, Spain, Great Britain ▪ East of the EU - Bulgaria, Czech Republic, Poland ▪ Non-EU Europe - Armenia, Bosnia and Herzegovina, Georgia, Kosovo, Northern Macedonia, Serbia, Switzerland, Ukraine ▪ Latin America - Argentina, Colombia, Ecuador, Mexico, Peru ▪ East Asia - Hong Kong, Indonesia, Japan, Philippines, Malaysia, Republic of Korea, Thailand, Vietnam, ▪ West Asia - Afghanistan, Azerbaijan, Kazakhstan, Kyrgyzstan, Pakistan, Turkey ▪ Africa - Nigeria, Ghana ▪ The United States, India, and Russia do not fall into any other regional category Sampling size and mode of field work: A total of 38,709 people were interviewed worldwide. Between October and December 2020, an interview was conducted with a representative sample of approximately 1,000 men and women was interviewed in each country, either in person, by telephone, or online. The survey error is from + 3-5% at the level of 95% of confidence. About Gallup International Gallup International Association (GIA) is a leading global independent market research and survey association. For more than 70 years, Gallup International members have demonstrated their expertise in conducting surveys in different countries on a comparative basis and ensuring the highest quality. Our more than 100 members and partners are leading national institutes with in-depth local knowledge of research methods and techniques, statistical sources, customs and cultural differences of their country and carefully selected by the Association Council. With only one member agency in each country, members work together every day to share knowledge, new research methods and tools, and to provide the most appropriate solutions for international research projects and to serve our clients as much as possible.
14.1.2021
|
|||||||||||||||||||||||||||||||||||||||||||||||||||||||||||||||||||||||||||||||||||||||||||||||||||||||||||||||||||||||||||||||||||||||||||||||||||||||||||||||||||||||||||||||||||||||||||||||||||||||||||||||||||||||||||||||||||||||||||||||||||||||||||||||||||||||||||||||||||||||||||||||||||||||||||||||||||||||||||||||||||||||||||||||||||||||||||||||||||||||||||||||||||||||||||||||||||||||||||||||||||
Our social media:
 KIIS page
 KIIS channel