INTERPERSONAL POLITICAL-PSYCHOLOGICAL TENSION OF THE POPULATION OF UKRAINE
The press release was prepared by Serhii Dembitskyi, Doctor of Sociology, Deputy Director of the Institute of Sociology of the National Academy of Sciences of Ukraine
From February 22 to March 6, 2023, the Kyiv International Institute of Sociology (KIIS) conducted its own all-Ukrainian public opinion survey "Omnibus". Bythemethodofcomputer-assistedtelephoneinterviews (CATI) based on a random sample of mobile phone numbers (with random generation of phone numbers and subsequent statistical weighting), 985 respondents living in all regions of Ukraine (except the Autonomous Republic of Crimea) were interviewed. The survey was conducted with adult (aged 18 and older) citizens of Ukraine who, at the time of the survey, lived on the territory of Ukraine (within the boundaries controlled by the authorities of Ukraine until February 24, 2022). The sample did not include residents of territories that were not temporarily controlled by the authorities of Ukraine until February 24, 2022 (AR of Crimea, the city of Sevastopol, certain districts of the Donetsk and Luhansk oblasts), and the survey was not conducted with citizens who left the country after February 24, 2022.
Formally, under normal circumstances, the statistical error of a sample of 985 respondents (first wave) (with a probability of 0.95 and taking into account a design effect of 1.1) did not exceed 3.4% for indicators close to 50%, 3.0% for indicators , close to 25%, 2.1% - for indicators close to 10%, 1.5% - for indicators close to 5%.
Under conditions of war, in addition to the specified formal error, a certain systematic deviation is added. In particular, if back in May, among all the respondents we interviewed, 2.5-4% lived in the territories occupied after February 24 (and this corresponded to the percentage of those who live there, because the generation of telephone numbers was random), now, due to the occupiers turning off the telephone connection, we managed to interview only 1 respondent (out of 985), who currently lives in the occupied settlements. It is important to note that although the views of the respondents who lived in the occupation were somewhat different, the general trends were quite similar. That is, the impossibility of interviewing such respondents does not significantly affect the quality of the results. There are other factors that can affect the quality of results in "wartime" conditions (see Annex 2).
In general, we believe that the obtained results are still highly representative and allow a fairly reliable analysis of public moods of the population.
Main conclusions:
1) The general situation, in comparison with December 2021, has not fundamentally changed. This is manifested in two aspects. First, the respondents also indicate that they more often felt negative emotions from potentially conflictual communication on political topics than from the impropriety of the interlocutors' behavior during such communication. Secondly, more than half of the respondents experience one or another level of interpersonal political and psychological tension. At the same time, the size of different categories of respondents in accordance with the expressiveness of their interpersonal political and psychological tension (low, medium or high) remained approximately at the same level.
2) Relatively stronger interpersonal political and psychological tension is characteristic of residents of the East and South of Ukraine. At the same time, tension is lower among those who moved to a new place after the start of the war.
3) There is a general tendency to increase the total number of the population without interpersonal political and psychological tension with increasing age. But it is the middle age groups (especially from 40 to 59 years old) that are characterized by the actualization of medium and high tension on the political ground.
4) The strongest interpersonal political and psychological tension is observed among potential voters of the “Yevropeiska Solidarnist” political party. In other electoral groups, the tension is significantly lower.
Interpersonal political-psychological tension is a type of distress (destructive stress) that arises as a result of an individual's excessive interest in political processes, as well as non-constructive communication on this issue with surrounding people. Interpersonal political-psychological tension can also cover those who have little interest in politics, but constantly interact with people who have a need for constant discussion of political problems.
In order to study the specified problem, the express variant of the "Interpersonal political-psychological tension" method (hereinafter - IPPS-EV, see Annex 1) was used, which allows assessing interpersonal political-psychological tension as normal, medium or high.
Frequency of cases causing interpersonal political-psychological tension; its generalized indicators
IPPS-EV includes two indicators that signal the respondent's interpersonal political and psychological tension - his own negative emotions as a result of such communication, as well as an assessment of the behavior of opponents who, in the opinion of the respondent, behaved incorrectly during the policy discussion.
Almost half of the respondents indicated that they felt negative emotions from communicating with opponents on political topics (Graph 1). For more than a year, the number of those who could not recall such cases in the last month decreased slightly - from 55.4% to 51.5%. At the same time, the encounter with someone else's hostility during the corresponding communication passed a larger share of people (Graph 2). Thus, the number of those who noted the lack of relevant experience changed from 67.7% to 69.9%.
As at the end of 2021, in February 2023 the number of those who almost daily experience negative feelings from arguments on political topics is several times higher than the corresponding category that faces hostility from interlocutors (8.5% vs. 2.0%).
Graph 1. Frequency of own negative feelings during discussions on political topics in the last 30 days, %

Graph 2. Frequency of unacceptable behavior of interlocutors during discussions on political topics in the last 30 days, %

In the following, an aggregated indicator of interpersonal political and psychological tension is used, which is calculated as the sum of individual indicators of IPPS-EV with further grouping of the obtained values into four intervals. As a result of the addition, the indicator can take a value from 0 (in the last 30 days, there were no relevant cases) to 8 (for both characteristics, the respondent chose the answer option "Almost every day").
In view of this, the grouping was carried out as follows: 1) 0 corresponds to the absence of interpersonal political and psychological tension in the last 30 days; 2) values from 1 to 3 – low interpersonal political and psychological tension; 2) values from 4 to 6 – medium interpersonal political and psychological tension; 3) if at least one of the indicators selected the answer option "Almost every day", a conclusion was made about the high interpersonal political and psychological tension of the respondent (values from 7 to 8 also fall under this rule).
As a result, it was found that a little more than half of the respondents experience low, medium or high interpersonal political and psychological tension (Graph 3). Compared to December 2021, the situation remained practically the same.
Graph 3. Expressiveness of interpersonal political-psychological tension among respondents, %

Level of interpersonal political-psychological tension in different socio-demographic groups
Considering the respondents in terms of gender, if to focus on its medium and high level, we can say that the expressiveness of interpersonal political-psychological tension is slightly higher among women than among men (Graph 4).
Graph 4. Expressiveness of interpersonal political-psychological tension depending on the respondent's gender, %

From the point of view of age division, several interesting points can be noted (Graph 5). In general, more expressive interpersonal political-psychological tension is characteristic of respondents aged 40 to 69 years. At the same time, among the youngest group (18-29 years), there is the smallest number of people with no political-psychological tension. That is, involvement in conflict communication on political topics is the most common among them, but with the weakest negative effects. A certain weakening of the negative effects of communication on political topics is observed in the oldest age group.
Graph 5. Expressiveness of interpersonal political-psychological tension depending on the age of respondents, %

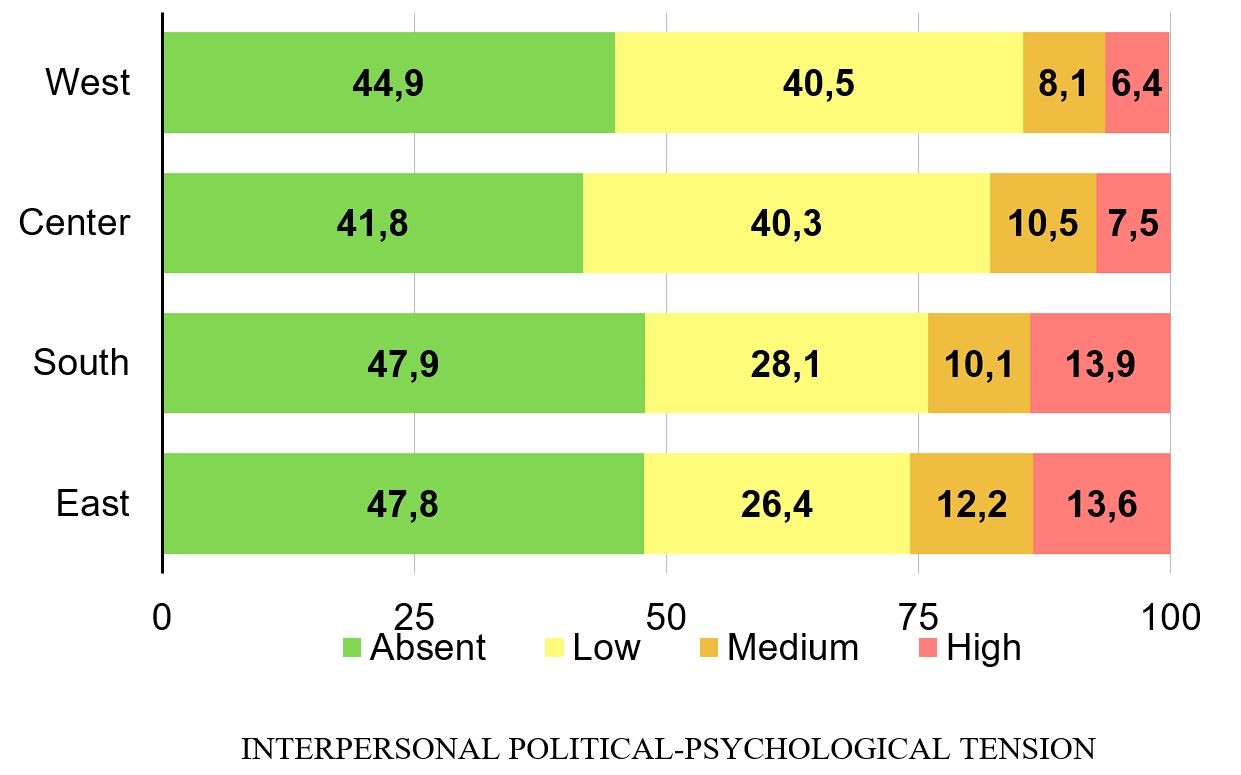
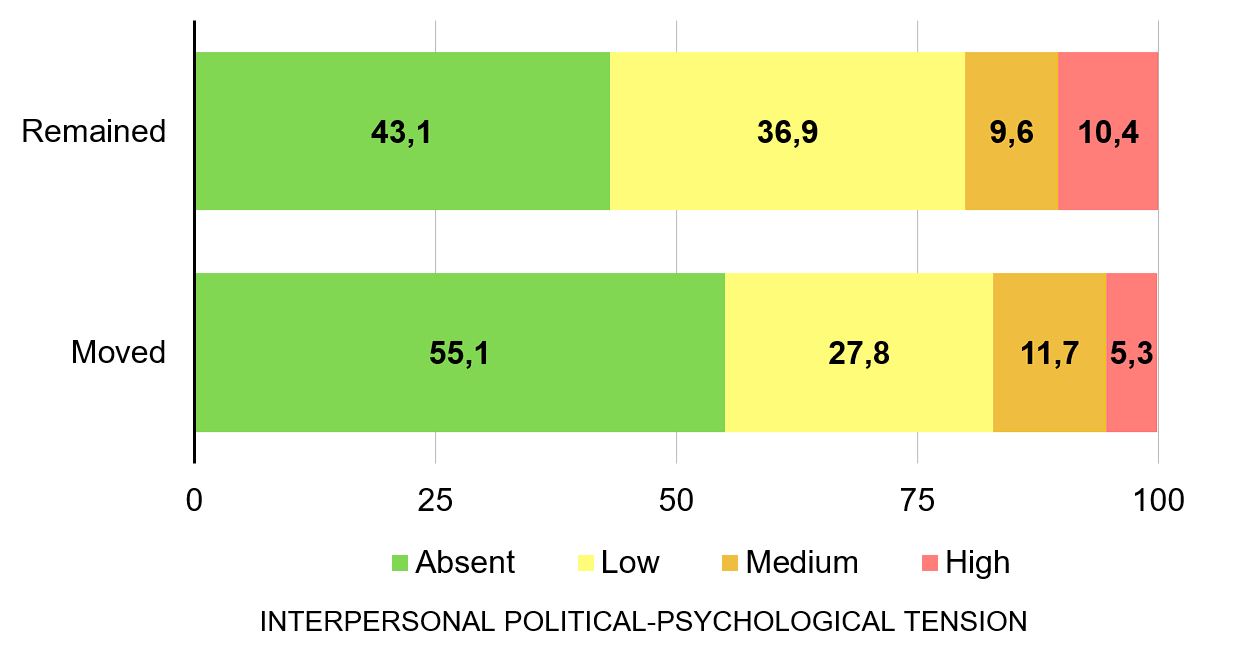
In accordance with the regional division (Graph 6), interpersonal political-psychological tension is more pronounced in the South and East of Ukraine, although greater involvement in conflict communication on political topics is characteristic of residents of the West and Center. It is interesting that the respondents who changed their place of residence due to the war feel significantly less the effects of interpersonal political-psychological tension compared to those who remained in the same place (Graph 7).
Graph 6. Expressiveness of interpersonal political-psychological tension depending on the region of residence of respondents, %
Graph 7. Expressiveness of interpersonal political-psychological tension depending on the change of residence, %
Level of interpersonal political-psychological tension in various national and political groups
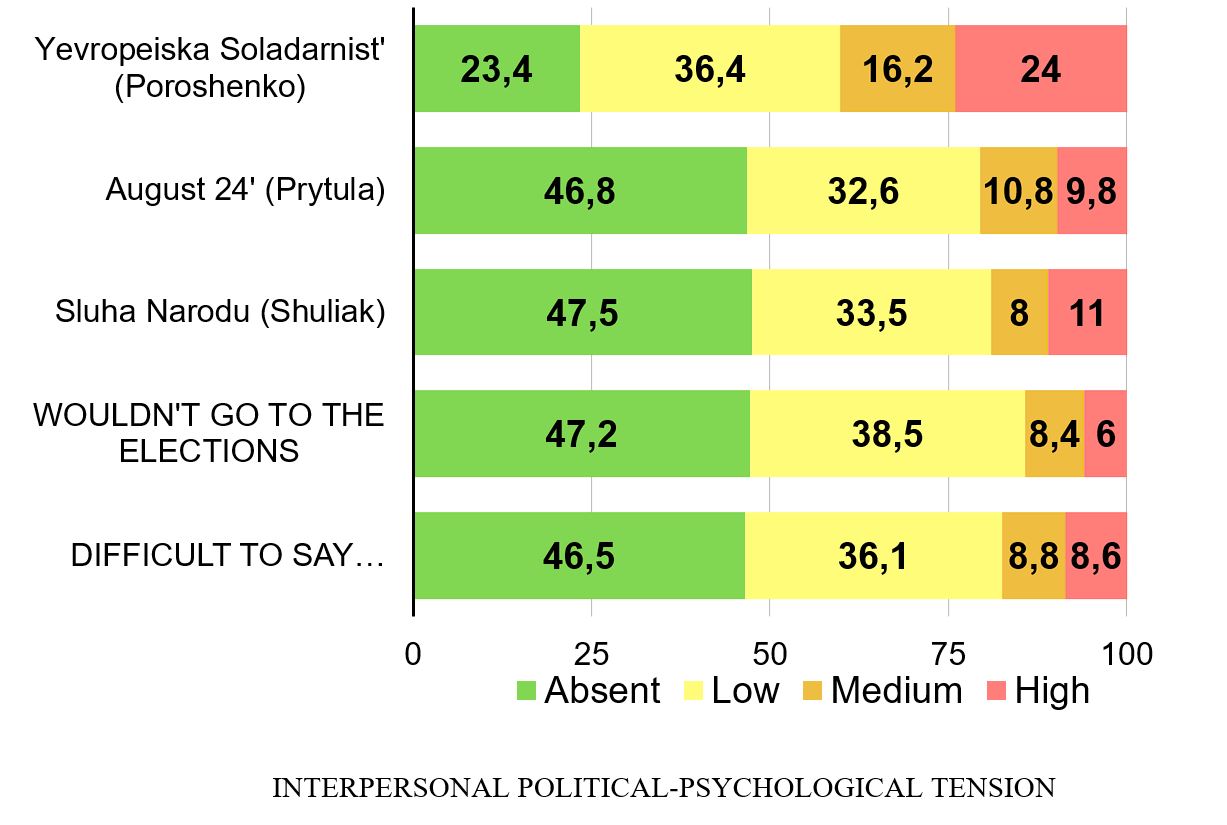
Finally, the dimension in which the group with the highest level of interpersonal political-psychological tension is fixed is the electoral one (Graph 8; political forces that were indicated in responses by fewer than 50 respondents have been removed from the corresponding graph, due to potential fluctuations due to random errors). Thus, only less than a quarter of potential voters of the political party "Yevropeiska Solidarnist" were not involved in conflict communications, and a medium or high level of corresponding tension is characteristic of more than 40% of them.
Supporters of other parties, as well as groups that are undecided or do not plan to go to the elections, are quite similar to each other and significantly different from potential voters of the "Yevropeiska Solidarnist" party.
Graph 8. Expressiveness of interpersonal political-psychological tension depending on the respondent's electoral preferences, %
Annex 1
IPPS-EV indicators
ppn1. Discussing politicians and political events with people who support the opposite point of view can lead to negative emotions and impressions (for example, a feeling of dissatisfaction with the interlocutor, irritation, the impulse to speak in raised tones, etc.).
How often in the last 30 days have you had similar feelings during or immediately after the relevant communication (it doesn't matter whether in real life or on the Internet)?
- Cannot recall such cases.
- Once or twice.
- Several times a month.
- Several times a week.
- Almost every day.
ppn2. Speaking about your interlocutors during such communication, how often in the last 30 days did you encounter the fact that your interlocutor behaved unconstructively (for example, violated the norms of decency in communication, stubbornly did not want to understand you, was hostile, etc.)?
- Cannot recall such cases.
- Once or twice.
- Several times a month.
- Several times a week.
- Almost every day.
Annex 2. Methodological comments on the representativeness of telephone surveys conducted during the war
Even before the full-scale Russian invasion on February 24, 2022, there were a number of factors that negatively affected the representativeness of the surveys (for example, the absence of a census for more than 20 years). A full-scale war, of course, greatly affects representativeness and complicates the work of sociologists, but does not make it impossible. Access to reliable data on the state of public moods remains relevant both for Ukrainians themselves and for our foreign partners (who, as the events of recent months have shown, often underestimated and did not understand Ukraine and Ukrainians).
At the same time, in order to maintain objectivity, it is necessary to understand what limitations the war imposes on the conduct of sociological surveys. First of all, we pay attention to large-scale population movements. As of December, the UN estimates the number of Ukrainian refugees at almost 7.9 million. Obviously, due to various reasons, it is difficult to consider these data unequivocally accurate, but in general, the quite significant scale of departure from the country is understandable. There is no exact data on how many of them are adult citizens, but, most likely, it is about half. Among about 30 million adult citizens (estimated at the time of the full-scale invasion), it can be roughly estimated that about 15-20% have left the country, and it is impossible to reliably survey these citizens using telephone interviews. Even more citizens have become internally displaced persons, but they have a much smaller impact on the quality of telephone surveys, since almost all of these citizens have mobile phones and are reachable to participate in the survey (in fact, 12% of the respondents of this survey are IDPs).
Another important problem is the accessibility for the survey of the population of the territories that were occupied after February 24, 2022, due to the conduct of intensive military operations or due to interruptions in telephone connection. Now there is practically no connection. In May, 2.5-4% of respondents lived in these territories, now in the sample of residents of these territories - only 1 respondent out of 985 surveyed. According to our estimates, the territory occupied by Russia as of the beginning of September (occupied after February 24, 2022) accounted for about 9% of the entire adult population. Taking into account the mass exodus of the population from these territories (most likely, we are talking about at least half of the population), as well as the fact that significant territories of Kharkiv and Kherson regions were liberated from this period, we estimate that no more than 3-5% of the total adult population of Ukraine were unavailable due to connection problems.
In our opinion, a more significant impact on representativeness can be either a generally lower readiness of citizens with "pro-Russian" attitudes to participate in surveys, or the insincerity of those who did take part in the survey (taking into account the obvious facts and prevailing opinions in the media regarding the Russian invasion , some citizens will not want to say what they really think "in public"). If to talk about the general readiness of respondents to participate in the survey, then in recent surveys we see either the same indicators or somewhat lower (although it should be borne in mind that the lower readiness to participate of "pro-Russian"-minded citizens can be compensated by the higher readiness to participate of "pro-Ukrainian"-minded citizens).
We conducted a methodical experiment in May, which shows that the citizens who are currently participating in the surveys in terms of demographic characteristics and meaningful attitudes are close to those who participated in the surveys until February 24, 2022. Preliminarily, we see some shift in the direction of "pro-Ukrainian"-minded citizens, which is reflected in up to 4-6% deviations for individual questions (in the direction of more frequent selection of answers that correspond to the "pro-Ukrainian" interpretation of events). In our opinion, in the current conditions, this is a rather optimistic indicator.
However, this experiment does not give an answer as to how sincere the respondents are now in their answers. To assess the sincerity of responses to sensitive questions, in July we conducted another experiment using the "imagined acquaintance" method. The results showed that the respondents generally answered the survey questions honestly. That is, we have reason to say that during the interview, the respondents really answer our questions sincerely.


 KIIS page
 KIIS channel